반응형
덴하덴하 ~
machine learning modeling을 할때 preprocessing을 한 후 각 피처들간의 correlation을 보는게 좋음
detail source : towardsdatascience.com/feature-selection-correlation-and-p-value-da8921bfb3cf
Feature selection — Correlation and P-value
Often when we get a dataset, we might find a plethora of features in the dataset. All of the features we find in the dataset might not be…
towardsdatascience.com
각 피처들간의 연관성이 깊게 되면 불필요한 중복(redundancy)이 생기게 됨.
불필요한 중복과 후에 모델에 쓰인 변수 설명의 난해함을 미연에 방지하기 위해
연관성이 높은 변수들은 그 성질을 대표할 수 있는 하나의 변수만 선택해줘야 함.
input 변수들간의 correlation 보는 방법
step1. load data
step2. function = cor, corrplot(package = corrplot)
step3. visualization and selection
step1. load data
df <- read.csv("eG_full_final_v2.csv", fileEncoding = "utf-8", stringsAsFactors = F)
*missing value가 있으면 안됨.
df_nna <- na.omit(df)
step2. using cor package
df.cor <- cor(df_nna[,-1], method = c("spearman"))
df.cor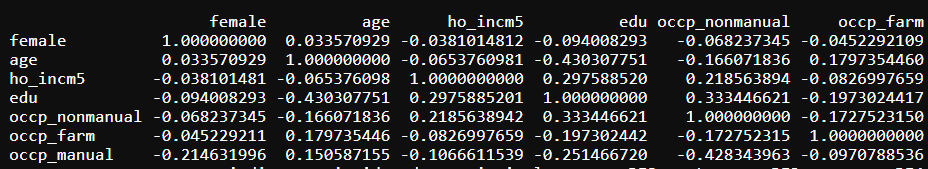
step3. visulization and selection
corrplot(df.cor, method = "color", addCoef.col = "grey", order = "FPC",number.cex = 7/ncol(df.cor), tl.cex = 0.5)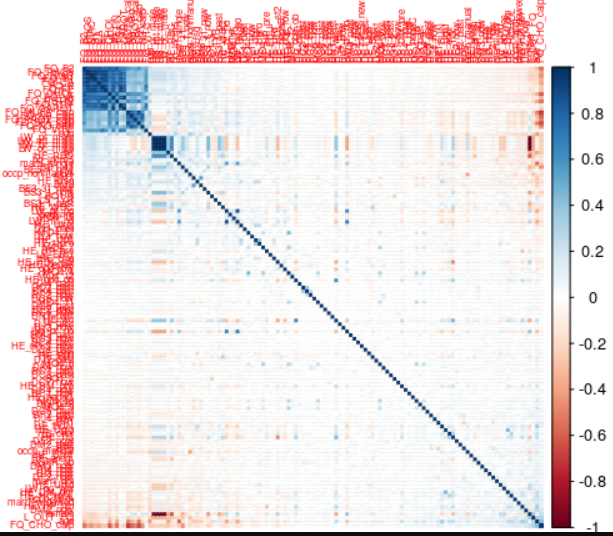
본인이 사용한 input 변수들이 너무 많기 때문에
한번에 plot으로 확인하기 쉽지않음 --> 나눠서 plot을 그리던지 다른 방법을 이용
df_cor_test <- as.data.frame(apply(df.cor, 2, function(x) ifelse (abs(x) >= 0.8,x,"NA")))
df_cor_test

summary(df_cor_test)
correlation matrix에서 coefficiency가 0.8 이상인 값들만 좀 보고 싶음 나머지는 NA표기
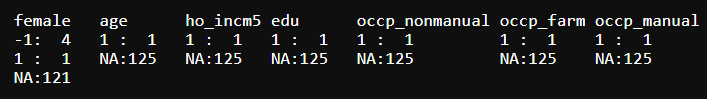
female과 coefficienct가 -1인 피처가 4개 있음
이제 무엇을 고를지 고민해야함 ; 본인은 female을 남기고 나머지를 제거함.


