
덴하덴하~ ♬
원형그래프 , 막대그래프를 R로 그려보는 시간을 가져볼까해유
우선 그래프 그릴 데이터를 가져와유
제가 가져온 데이터는 이런 데이터에유
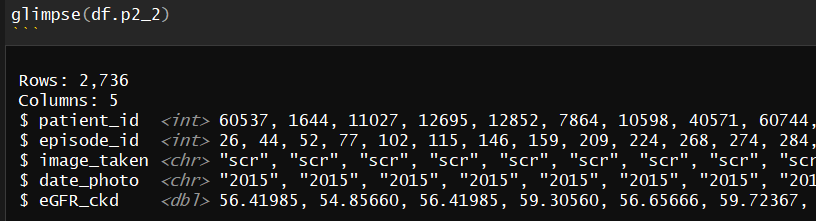
image_taken이라는 factor 변수 별로 어떻게 데이터가 어떻게 분포되어있는지 visualization을 해볼거에유
전체 분포중 image_taken의 각 factor에 해당하는 N수가 얼마나 되는지 볼거예유
우선 기본 ggplot으로 bar chart를 그려봐유
geom_bar 옵션중에 position 을 "fill"로 설정해 주세유
library(ggplot2)

df.p2_2 %>%
  ggplot(aes("", fill=image_taken)) +
geom_bar(position = "fill") 
그럼 여기서 coord_polar() 를 붙여주면 간단하게 원형 그래프를 만들어 줄 수 있어유
df.p2_2 %>%
  ggplot(aes("", fill=image_taken)) +
  geom_bar(position = "fill") +
  coord_polar(theta = "y")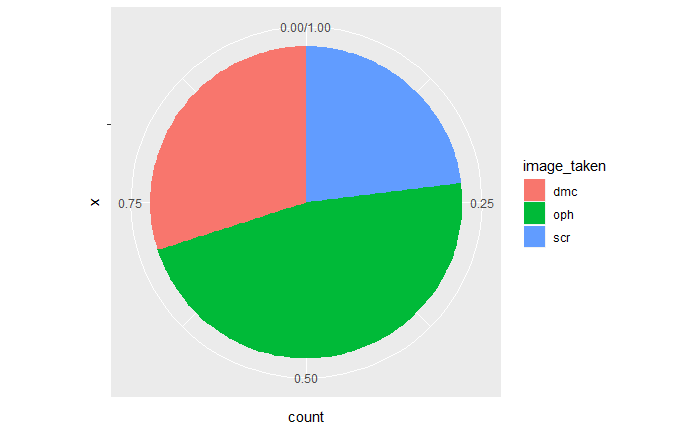
여기에 비율을 labeling 해주고 싶다면 geom_text()를 좀 손봐야 해유
df.p2_2 %>%
  ggplot(aes("", fill=image_taken)) +
  geom_bar(position = "fill") +
  coord_polar(theta = "y") +
  geom_text(data = . %>%
              group_by(image_taken) %>%
              tally() %>%
              mutate(p = n / sum(n)) %>%
              ungroup(),
            aes(y = p, label = scales::percent(p)),
            position = position_stack(vjust = 0.5),
            show.legend = FALSE)
그럼 이번에는 다른 막대 그래프 형태로 한번 그러볼게유
각 년도별로 image_taken의 각 factor별로 상대적인 비율이 어떤지 볼게유
df.p1 %>%
  filter(eGFR_ckd < 60) %>%
  ggplot(aes(date_photo, fill = image_taken)) +
  geom_bar(position = "fill") +
  geom_text(data = . %>%
              group_by(date_photo, image_taken) %>%
              tally() %>%
              mutate(p = n / sum(n)) %>%
              ungroup(),
            aes(y = p, label = scales::percent(p,accuracy = 2)),
            position = position_stack(vjust = 0.5),
            show.legend = FALSE)
이번에는 각 년도별로 절대적인 count를 볼거예유 position 옵션을 "dodge"로 바꿔주기만 하면 되유
df.p1 %>%
  filter(eGFR_ckd < 60) %>%
  ggplot(aes(date_photo, fill = image_taken)) +
  geom_bar(position = "dodge")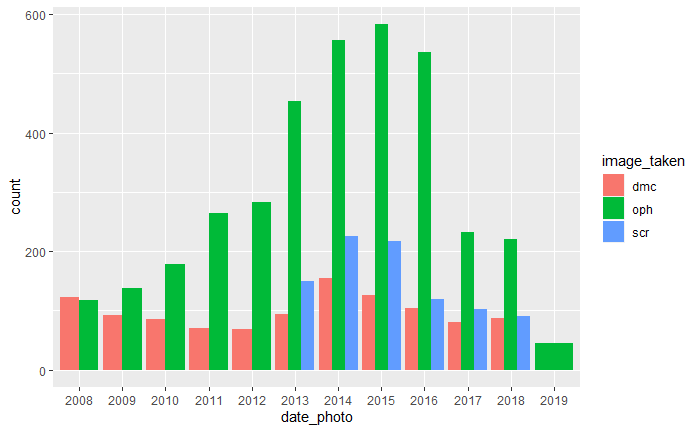
여기까지 대충 해당 variable의 factor 별로 절대적인 N수, 상대적인 비율을 확인해보는
visulaization을 R로 한번 해봤어유 생각보다 간단해유~~♬


