
bootstrap을 이용해서 신뢰 구간(CI, confidence interval) 구하기
0. background
1. bootstrap
2. R에서 bootstrap을 이용해서 신뢰구간 구하기
3. python에서 bootstrap을 이용해서 신뢰구간 구하기
0. background
- machine learning 모델들의 성능비교에 신뢰 구간은 필수적.
- 흔히 AUROC나 sensitivity, specificity 같은 지표들이 성능 평가에 사용됨.
- 성능 지표들에 따라 여러 통계기법들이 사용되고 있음.
- data science는 많은 샘플링이 가능하기 때문에 bootstrap 방법으로 여러 샘플링을 할 수 있음.
- bootstrap 방법으로 신뢰 구간을 구해 볼거임.
- R에서는 "pROC" 패키지를 통해 간단하게 계산 할 수 있음.
-> 하지만 sample_weight가 적용된 모델에 대한 신뢰 구간을 구하는데는 한계가 있음.
- python에서는 scikit-learn의 유틸 조합으로 sample_weight가 적용된 모델의 신뢰 구간 계산이 가능함.
1. bootstrap
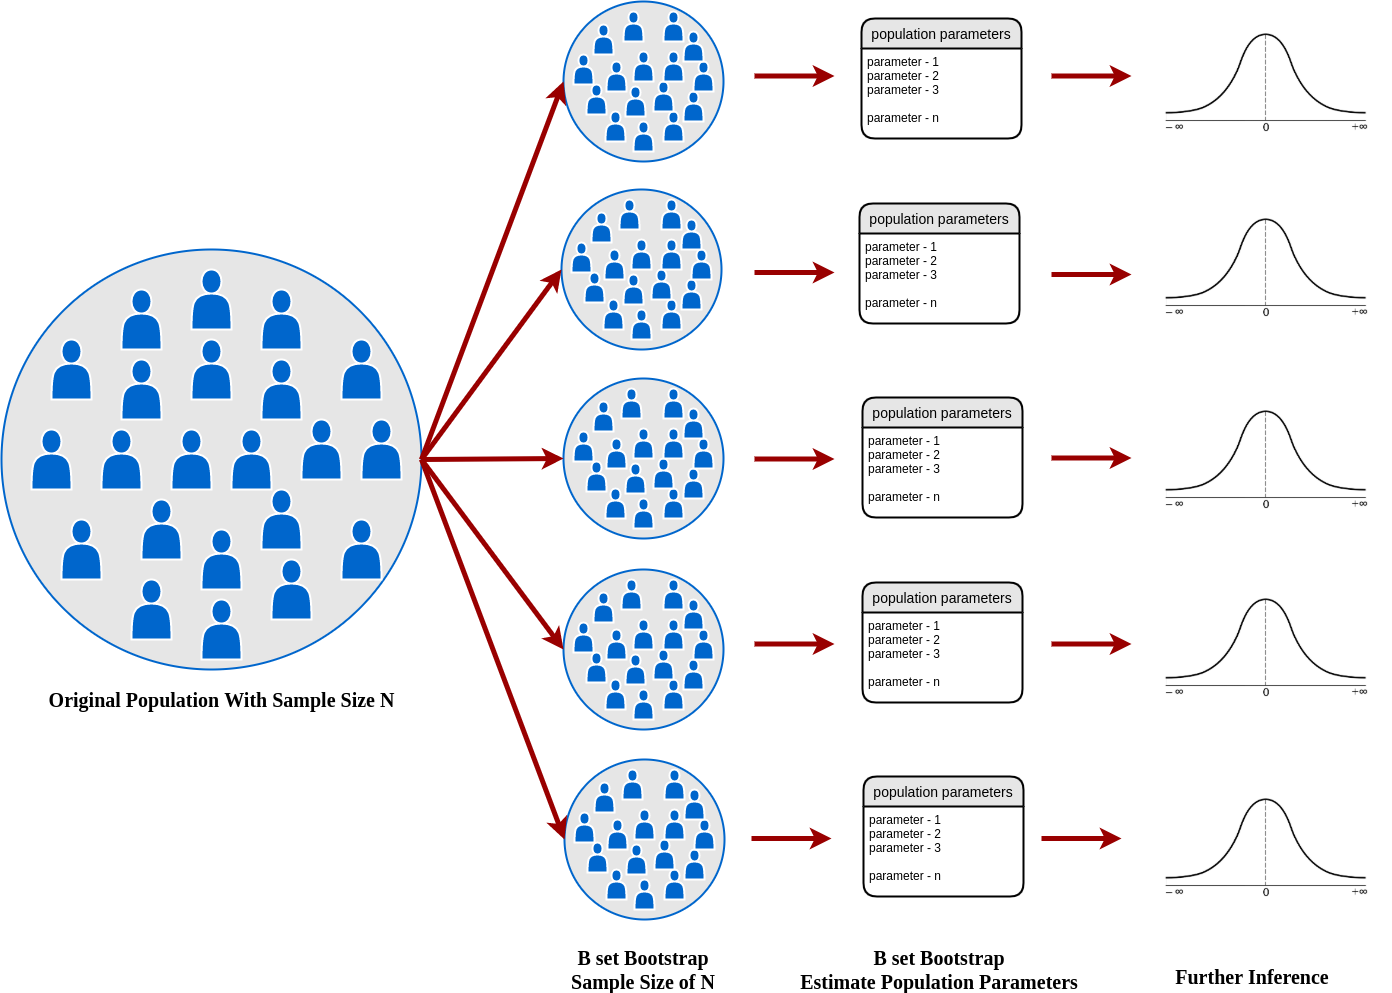
- 간단히 요약해서 전체데이터에서 중복을 허용하여 모집단과 같은 size로 원하는 수 만큼 샘플링을 하는것.
- 원하는 수 만큼 샘플링한 모든 데이터의 수치에서 2.5%, 50%, 97.5%를 취함(95% Confidence Interval).
- 보통 2000번정도 하는 것을 권장하지만 10000번 정도 이상하면 좋음.
- clinical 에서 신뢰 구간을 구하는 데 굉장히 powerful한 방법으로 통함.
Resampling Methods — A Simple Introduction to The Bootstrap Method
Intuition, motivation, and how it works on the bootstrap method
arifromadhan19.medium.com
Bootstrap confidence intervals
This article surveys bootstrap methods for producing good approximate confidence intervals. The goal is to improve by an order of magnitude upon the accuracy of the standard intervals $\hat{\theta} \pm z^{(\alpha)} \hat{\sigma}$, in a way that allows routi
projecteuclid.org
2. R에서 bootstrap을 이용해서 신뢰구간 구하기
- R에서는 "pROC"를 이용해서 여러 기법들을 이용해서 쉽게 신뢰 구간을 계산할 수 있음.
- method를 bootstrap으로 변경해주면 됨.
##auc delong
print("delong auc"); ci.auc(df$label, df$probability)

##auc bootstrap
print("bootstrap auc"); ci.auc(df$label, df$probability, method="bootstrap", boot.n=2000)

##fixed threshold se, sp
print("se, sp in fixed best threshold"); ci.thresholds(roc(dfp$label, df$probability), thresholds = 0.5, conf.level = 0.95, boot.n=2000)

##th, se, sp bootstrap
ci.coords(roc(df$label, df$probability), x="best", ret=c("threshold", "sensitivity", "specificity"), boot.n = 2000)
참고 : https://www.rdocumentation.org/packages/pROC/versions/1.17.0.1
pROC package - RDocumentation
pROC An R package to display and analyze ROC curves. For more information, see: Xavier Robin, Natacha Turck, Alexandre Hainard, et al. (2011) “pROC: an open-source package for R and S+ to analyze and compare ROC curves”. BMC Bioinformatics, 7, 77. DOI:
www.rdocumentation.org
3. python에서 bootstrap을 이용해서 신뢰구간 구하기
- python에서는 scikit-learn의 툴을 조합해서 사용할 수 있음.
- "resample"을 중복을 허용하게(replace=TRUE) 원하는 샘플 수 만큼 시행.
- 샘플마다 모든 지표들을 구하고 해당 지표의 2.5%, 50%, 97.5%의 값을 가져옴.
- 무엇보다 "sample_weight" 옵션을 사용할 수 있는 것이 강점.
-> weighted AUROC나 weighted sensitivity, weighted specificity를 구할 수 있음.
# weighted CI

# load dataset
data = df

# configure bootstrap
n_iterations = 2000
n_size = len(data)

# run bootstrap
auc_box = []
th_box = []
se_box = []
sp_box = []

for i in range(n_iterations):
    boot = resample(data, n_samples=n_size, replace=True, stratify=data['label'])
    auc = roc_auc_score(boot['label'], boot['prob'], sample_weight=boot['wt'])

    auc_box.append(auc)

    # calculate roc curves
    fpr, tpr, thresholds = roc_curve(boot['label'], boot['prob'], sample_weight=boot['wt'])
    J = tpr - fpr
    ix = argmax(J)
    best_thresh, se, sp = thresholds[ix], tpr[ix], 1-fpr[ix]

    th_box.append(best_thresh)
    se_box.append(se)
    sp_box.append(sp)

# plot scores
plt.hist(auc_box)
plt.hist(th_box)
plt.hist(se_box)
plt.hist(sp_box)
plt.show()

# confidence intervals
alpha = 0.95
p = ((1.0-alpha)/2.0) * 100
lower_auc = max(0.0, np.percentile(auc_box, p))
p = (alpha+((1.0-alpha)/2.0)) *100
upper_auc = min(1.0, np.percentile(auc_box, p))
print('auc mean:%.3f, median:%.3f, CI %.3f - %.3f' % (mean(auc_box), np.median(auc_box), lower_auc, upper_auc))

p = ((1.0-alpha)/2.0) * 100
lower_th = max(0.0, np.percentile(th_box, p))
p = (alpha+((1.0-alpha)/2.0)) *100
upper_th = min(1.0, np.percentile(th_box, p))
print('th mean:%.3f, median:%.3f, CI %.3f - %.3f' % (mean(th_box), np.median(th_box), lower_th, upper_th))

p = ((1.0-alpha)/2.0) * 100
lower_se = max(0.0, np.percentile(se_box, p))
p = (alpha+((1.0-alpha)/2.0)) *100
upper_se = min(1.0, np.percentile(se_box, p))
print('se mean:%.3f, median:%.3f, CI %.3f - %.3f' % (mean(se_box), np.median(se_box), lower_se, upper_se))

p = ((1.0-alpha)/2.0) * 100
lower_sp = max(0.0, np.percentile(sp_box, p))
p = (alpha+((1.0-alpha)/2.0)) *100
upper_sp = min(1.0, np.percentile(sp_box, p))
print('sp mean:%.3f, median:%.3f, CI %.3f - %.3f' % (mean(sp_box), np.median(sp_box), lower_sp, upper_sp))How to Calculate Bootstrap Confidence Intervals For Machine Learning Results in Python
It is important to both present the expected skill of a machine learning model a well as confidence intervals for […]
machinelearningmastery.com


