반응형

1. moonBook pacakges
2. Explore a mytable() function
3. Densityplot
4. ORplot
5. HRplot
1. moonBook pacakges
- library and sample dataset
require(moonBook)

data(acs)

str(acs)
2. Explore a mytable() function
- basic fuction
mytable(acs)

mytable(~.,data=acs)
# select + variables
mytable(~age+sex, data=acs)
# select - variables
mytable(~.-age-sex, data=acs)
- by group
mytable(sex~., data=acs)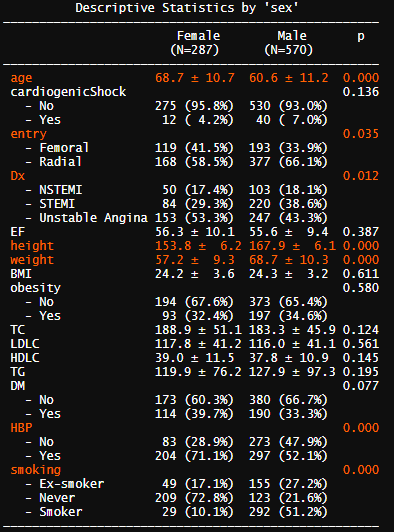
mytable(sex+Dx~., data=acs)
mytable(sex+Dx~.-age-EF-TC, data=acs)
- save as csv file
out=mytable(Dx~.,data=acs)
mycsv(out,file="test.csv")
3. Densityplot
densityplot(age~sex, data=acs)
4. ORplot
require(survival)
data(colon)

out1=glm(status~sex+age+rx+obstruct+node4,data=colon)
out2=glm(status~rx+node4,data=colon)
ORplot(out1,type=2,show.CI=TRUE,xlab="This is xlab",main="Odds Ratio")
ORplot(out1,type=1,show.CI=TRUE,xlab="This is xlab",main="Odds Ratio")
ORplot(out1,type=1,show.CI=TRUE,col=c("blue","red"))
ORplot(out1,type=4,show.CI=TRUE,sig.level=0.05)
ORplot(out1,type=1,show.CI=TRUE,main="Odds Ratio",sig.level=0.05,
        pch=1,cex=2,lwd=4,col=c("red","blue"))
5. HRplot
attach(colon)
colon$TS=Surv(time,status==1)
out=mycph(TS~.,data=colon)
out
HRplot(out,type=2,show.CI=TRUE,cex=2,sig=0.05,
       main="Hazard ratios of all individual variables")


